
Project Forecasting Using Monte Carlo Method
The first article in this series is here (Notes on Kanban Metrics)
Traditional approach to forecasting project completion dates
What is a traditional way to forecast project completion date?
We take:
- Average velocity per Iteration/Period (e.g. Story Points per Sprint, Number of Done stories per Week, etc.)
- Backlog size (number of stories or estimated in Story Points, etc.)
and do the math:
Iterations left = Backlog size / Avg. velocity
This method implies that Avg. velocity and Backlog size are constant, which (unfortunately) they are not.
Pros of this method:
- easy to calculate
- gives a simple single number
Cons:
- gives a single number, and we know that they are fundamentally wrong (see
Probabilistic Worldsection here) - doesn’t account for uncertainty and variability (estimation errors, etc.)
- doesn’t account for velocity changes (due to tech debt, team dynamics, external dependencies, etc.)
- doesn’t account for backlog size changes (bugs, rework, new requirements, change requests, etc.)
In real world this approach gives us 50th percentile (see Good boys - Percentiles section here) at best.
Think about it.
It is a 50% probability that we will hit the date. And a 50% probability that it will take longer (maybe by multiple times longer). Are you ready to accept this risk?
We need something better, that can take into account variability in inputs - say hello to the Monte Carlo Simulation Method!
Monte Carlo Simulation Method
Monte Carlo Methods - are a broad class of computational algorithms that rely on repeated random sampling to obtain numerical results.
(c) Wikipedia. Note: Keywords are repeated and random.
The Method was developed in the 1940s and gained wide usage in multiple fields: physical sciences, engineering, computer graphics, statistics, etc.
Monte Carlo Method, in general, consists of the next steps:
- Define possible inputs and their probability distribution
- Generate random inputs based on inputs’ probability distribution
- Perform a deterministic computation
- Aggregate the results
Inputs
In our case Inputs would be our Historical data:
- number of completed user stories per period (week/sprint/etc.)
- number of remaining user stories per period
Ouptuts
Outputs, in our case, would be the range of dates with assigned probabilities of completing a project on a given date or earlier.
You may ask - What will I do with the range of dates?! I need only one date! - in that case, please, read Probabilistic World section here.
In short - choose the percentile that is comfortable to you and it will give you a single date.

Magic Excel file
Download fully ready Excel file here.
Full credits go to amazing Troy Magennis and Focused Objective.
How to use it
- Open the
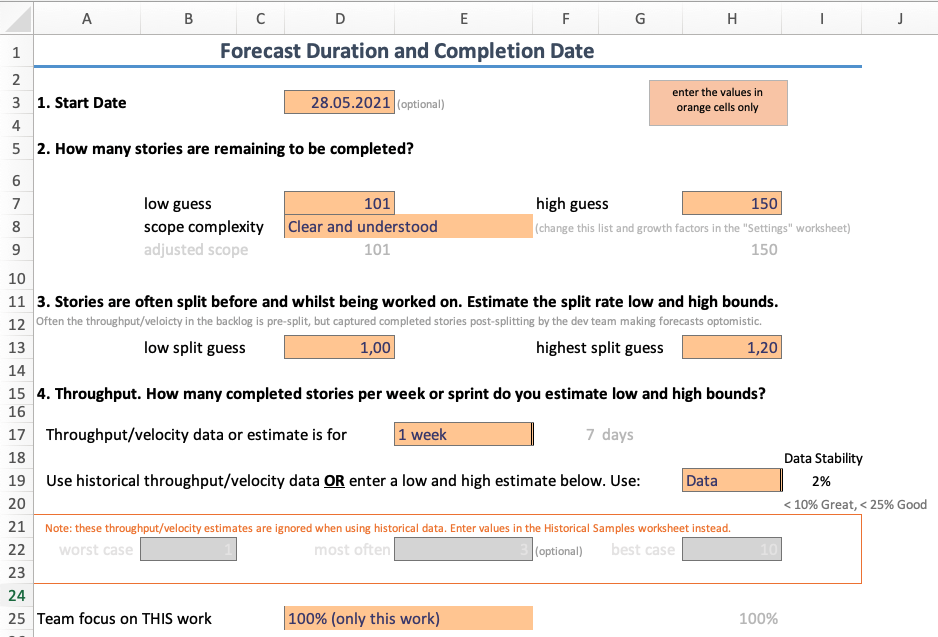
Forecasttab and fill general information inOrangecells (Start date, remaining stories (remember that in typical Software project around 40-80% is ‘dark matter’ so this number should be higher than the actual number of stories in your ticketing system), chooseUse historical datainstead of an estimate, etc.)
- Open the
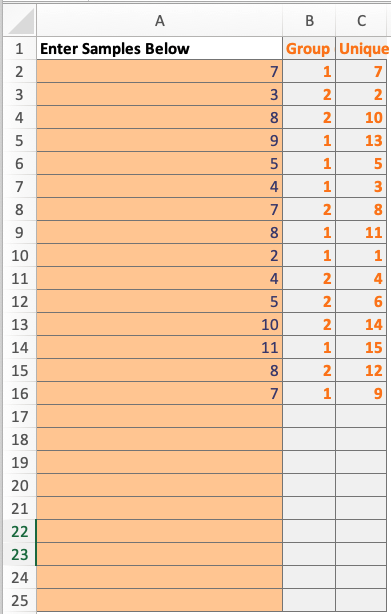
Historical Samplestab and fill yourThroughputdata inAcolumn (ignoreBandC)
- Open the
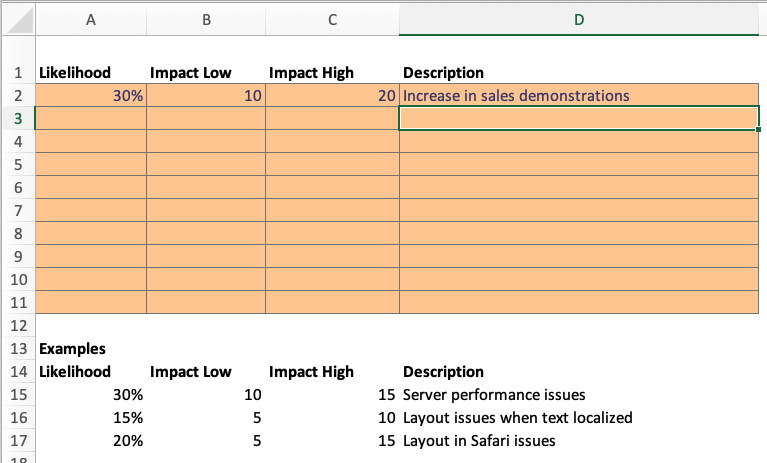
Riskstab and enter risks that can increase your user stories count (i.e. increase in a number of sales demonstrations, performance issues, etc.)
- Open the
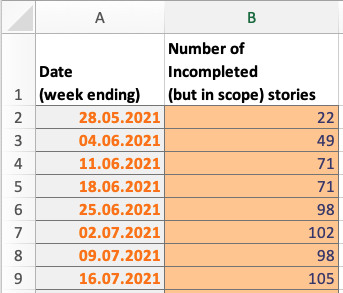
Remaining Stories Actualsand enter the number of remaining stories in backlog (including Work in progress) for each date you have the data.
- Again open the
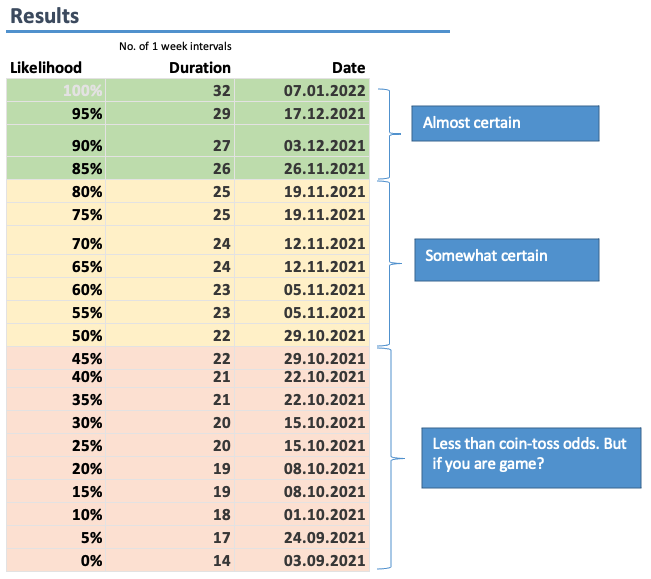
Forecasttab and use theResultstable to determine project completion date with the acceptable likelihood (general advice: use 85% or higher)
PROFIT.
PS. You can also see some interesting charts on the Charts tab.
How it works
The spreadsheet takes the entered data and randomly selects how many stories you will need to complete based on the range from historical data. Then it increases the remaining stories by a random number of split-stories and a random number of risk stories (all based on specified ratios). Then it randomly picks some of the historic throughput samples and simulates (500 times) burndowns to project completion.
Now we have 500 different simulations of our forecast, so we group them by probabilities of completion dates.

Conclusion
We have learned a method allowing us to forecast project completion dates which is taking variability into account and provides a much better result than the traditional approach.
What’s next?
Do some actions based on this information (or why would you forecast anything?):
- scope actions (limit, exceed)
- resource actions (allocate more, free some)
- process and tools actions
- change agreements with stakeholders on a completion date
- etc.