
Notes On Kanban Metrics (Lead time, Cycle time, Throughput)
Disclaimer: in this article we are talking about Kanban Method, described by David J. Anderson and not traditional manufacturing Kanban.
Second article in this series is here - Project Forecasting.
Kanban metrics
Key kanban metrics that we will discuss in this article:
- Lead time
- Cycle time
- Throughput
There are other metrics that we will not discuss right now, but they can be useful for you:
- Work In Progress (WIP)
- Cumulative Flow Diagram (CFD)
- Flow Efficiency Chart
Purpose of these metrics (Why do we need them?)
We can use these metrics for:
- Forecasting feature and/or project completion dates
- Setting SLE/SLAs for service
- Providing feedback loop for service improvement
Forecasting feature and/or project completion dates
Why forecast something? To do something about it! (c)
E.g.
- decide when to start a request to deliver it on time - according to SLEs/Committed date/etc.
- change the resource allocation for project or feature
- make decisions about the project’s scope
- prioritize work
- etc.
If you measure something and not doing anything as a result of your measurement - this is most likely a Muda or waste.
You should stop wasting time on this measurement or start using this data in your decisions and actions.
Setting SLE/SLAs for service
SLA - Service Level Agreement. The Agreement you make with your clients.
The Keyword is Agreement. The Client must agree with you (typically through a legal contract).
If you just say to your internal customer Our lead time is X. Deal with it - this is not an agreement :)

Most of the time this term is used for external clients and SLAs violation will result in a fine.
SLE - Service Level Expectations is a ‘soft’ kind of SLA used to move away from promises and strict legal commitments to more adaptive and realistic expectations.
For internal services we will mostly set SLEs and not SLAs and set them based on actual numbers.
Other SLX terms for reference:
- SLO - Service Level Objective. The Objective team must hit
- SLI - Service Level Indicators. The actual metrics of performance
Providing feedback loop for service improvement
We can use these metrics in our Service Delivery Reviews (standard Kanban cadence) to see how our changes in processes and tools affect our service as a system.
Beware: Goodhart’s law
There is a big temptation to use these metrics as KPIs, but you shouldn’t do this.
Any observed statistical regularity will tend to collapse once pressure is placed upon it for control purposes.
And it’s generalization by Marilyn Strathern:
When a measure becomes a target, it ceases to be a good measure.
In short: avoid setting KPIs based on these metrics - they will be abused and you will lose them as indicators.
E.g. how to reduce cycle time by two times?
- Do work faster
- or reduce the work item size, so it will go through the system faster
which way would be easier for the team?
Lead Time in Kanban
What is it for?
Answers a simple question: How long will this take?

Wait, but we already ask our devs that question, why do we need another metric for this?
Let’s see - developer estimates some work item as 8 hrs, but customer gets it delivered after 2 weeks (because work was sitting in a backlog for 2 days, there were some dependencies, testing, rework, documentation, deployment, etc.)
WTF?! says the customer :)

So developer’s estimates make almost no sense and no value in case of our question How long will this take?.
The Customer wants to know when he will get the final result and not how long a developer will write code - and the answer to this question is Lead Time.
But there are more deep questions to this: When it should be delivered? –> When we should commit to it?
So this metric also answers the question - When we must commit to this work to finish it on time?
Despite the simplicity of the question, this is a little confusing metric, because you need to agree on what it means :)
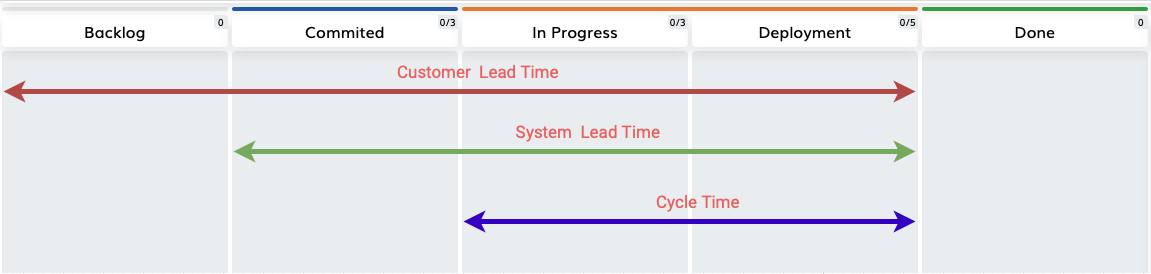
The most used meanings of Lead Time are:
Customer Lead Time- the time between a request being made by the customer and its delivery (includes everything happening between these points, so this is the biggest value)System Lead Time- the time between a request being formally accepted (or committed) by the team and its delivery to some ‘done’ column, which is usually the first column, that doesn’t have a WIP limit on it.
The second definition is more popular in Software development, so we will use it for the article.
In this case teams have a WIP-limited column, usually ‘Dev Ready’/’Engineering ready’/’Committed’ which acts as a committment point. Any work pulled in this column will start its Lead Time timer.
Also usually teams have some ‘precommitment’ column (e.g. ‘Pre-Analysis’) where they gather more information on work to be done to ensure dependencies are met, reduce risks, etc.
The reason for this kind of measurement is to support the maximum delay decision - we need to do what we must do and when we must do (not early and not late - Just In Time). And in Software development most of the kanban systems doesn’t have a requirement to deliver ALL of the requests - only the most valuable ones, so any work can sit and wait in a backlog waiting for its time and thus increasing Customer Lead Time indefinitely, so we need another metric :)
How to calculate Lead Time?
Just start writing down Committment date and Done date (most of task trackers already doing this you just need to learn how to get this information).
Then,
System Lead Time = Done date - Committment date
Cycle Time in Kanban
What is it for?
First Question: When it will be done if you start it right now?
Second question: When we must start it to finish before the expected delivery date?
And again you need to clearly define what Cycle Time means in your case.
Most of the time it has these meanings:
Cycle Time- the time between work is being started by someone and its delivery dateLocal Cycle Time- the time it takes for a work to pass through some phase of kanban system (e.g. from column A to column B, from Development to Deployment, etc.)
How to calculate Cycle Time?
Cycle Time = Done date - Started date
Lead Time vs Cycle Time in Kanban
Lead Time is what customers perceives. They don’t care if you have very fast Cycle Time, but Lead Time is big (and the term ‘big’ is also relative to the customer). So improvements should be focused on it.
Cycle Time is what team mostly perceives and controls.
Throughput in Kanban
What is it for?
Answers question: How many work items we will deliver in some period?, e.g. How many work items we will deliver in a month?
How to calculate Throughput?
Calculate the amount of work items delivered weekly, write it down, calculate monthly and other periods as needed.
Probabilistic world
And here comes inconvenient truth - we live in a probabilistic world and we do complex work with a high degree of uncertainty, so we actually can’t use simple discrete numbers to predict the future.
This is a very tough topic for managers as they often just refuse to accept it despite what actual numbers are saying.

Sad, but true.
Distributions
We should go to distributions for help.

So Lead Time, Cycle Time, etc. are not single numbers - they are distributions.
And to make things even more complicated - Lead Time and Cycle Time are NOT normal(bell-curved) distributions.
To get the value of Lead Time or Cycle Time we need to decide on the level of uncertainty that we agree to accept (choose a percentile).
So Lead Time from Our Lead Time is 10 days becomes With 95% probability our Lead Time is 15 days or less. Or with 80% probability 5 days or less. Choose what you like..
And we really should avoid using mode and average values for these metrics.
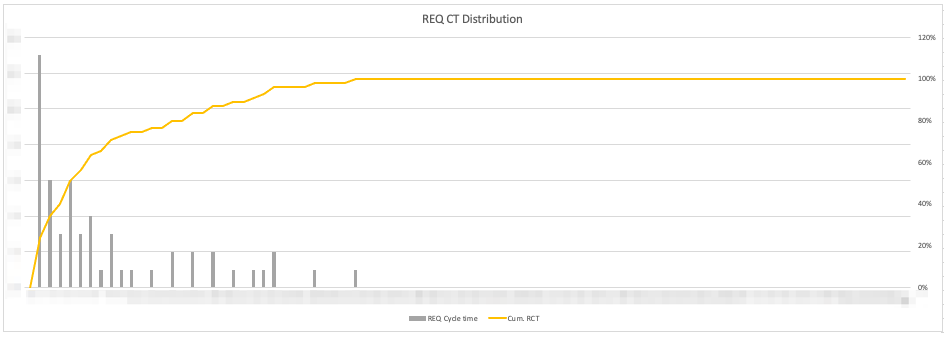
Lead Time and Cycle Time distributions
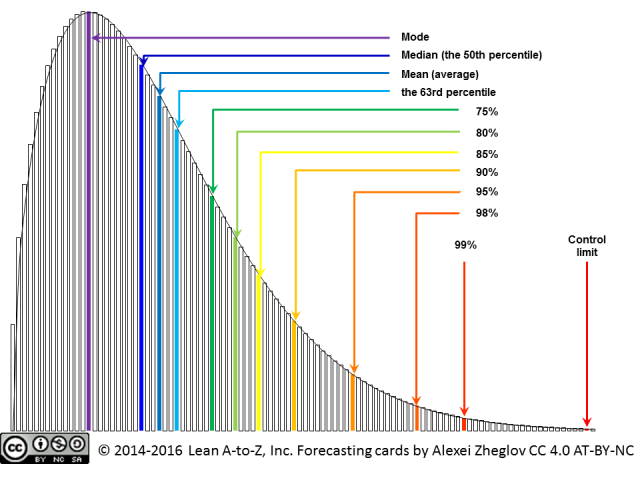
This is a common Lead Time distribution shape, in fact, it is often described by a named distribution - Weibull distribution with different shape parameters.
The left part of this distribution is limited, while the right (tail) is not. Which is a very sad thing for any Project Manager.
Distribution may differ for different work types and classes of service and you can (and should) also calculate them distinctly.
If we have a long tail - we should investigate and try to narrow it or extract features (type of work, class of service, etc.) to improve predictability.
How to create a chart like this?
Just make a histogram from your data (Cycle time, Lead time, etc.)
How much data do you need to plot this?
More is better, but 10-12 data points should be enough (according to Troy Magennis)
Why Averages are bad
Averages are useful when we have a normal or bell-shaped distribution, but they become misleading when we have a skewed distribution, like a Weibull.
See the picture above - the average has less than 63% probability, so in slightly less than a half of the times work will take MORE than average, and not simply more, but more by multiple times. Using this average to forecast project completion or setting SLA can lead to a disaster.
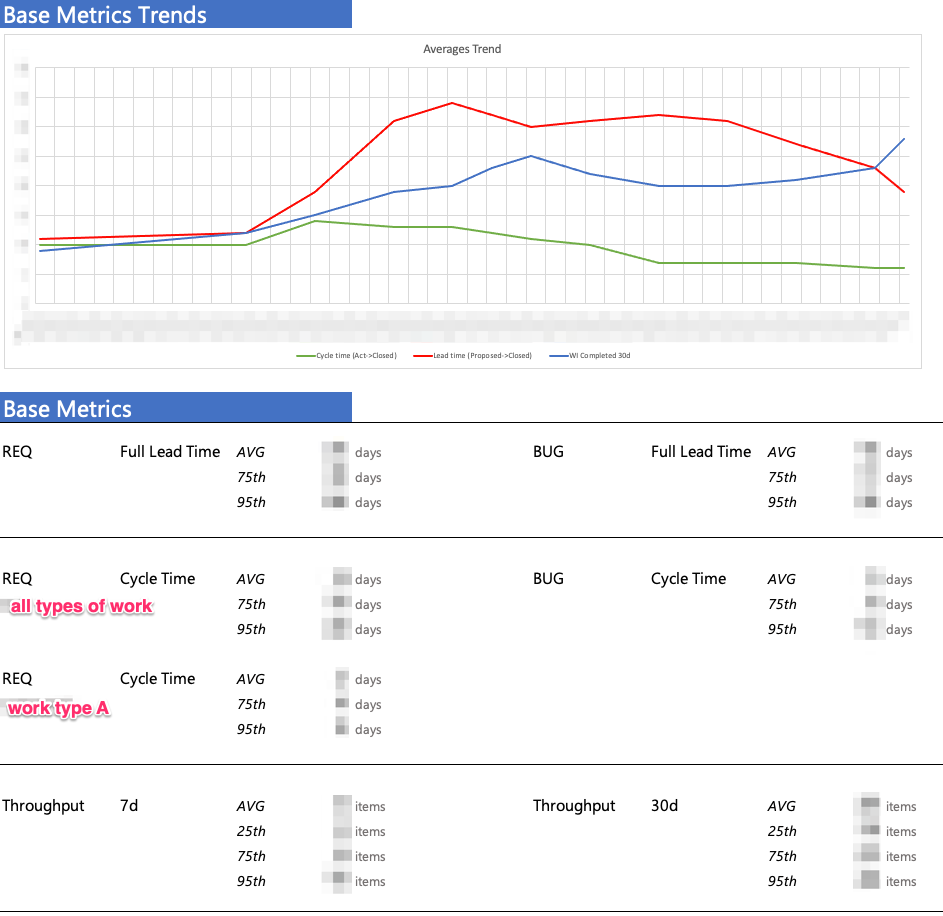
But, you can use averages for Lead Time and Cycle Time to observe their trends.
The Throughput metric most likely will have a normal distribution, so you can use an average in that case.
Beware of Mode
The mode is the most often occurring number in the data set (the ‘peak’ in distribution). It is easily remembered by humans (oh, the peak is X! so I will think it will take X days on average…), but again see the picture above - it has LESS than 50% probability (according to Alexey Zhiglov it is between 18%-28% in product development).
Beware to use it for forecasting.
Good boys - Percentiles
We should use percentiles to establish SLEs.
The most used percentiles are (note how big the difference in Lead Times for them will be): 80th, 85th, 90th, 95th, 98th, 99th.
E.g. we have a Lead Time of
- 10 days at 80th percentile
- 20 days at 99th percentile
This means that with a probability of 80% we will deliver work in 10 days or less, but if we want a guaranteed date (99th percentile) we will set an expectation to 20 days or less.
It is a good practice to establish different SLE/SLA based on type of work and/or class of service to improve predictability.
Examples (numbers are arbitrary):
| Work type | 99% | 80% |
|---|---|---|
| New feature | 15d | 3d |
| Bug | 7d | 2d |
| Change Request | 10d | 4d |
Customers/Managers can choose what level of risk to accept.
Example Kanban Metrics Dashboard
For one of our teams we use this basic dashboard that we update weekly:
following by snapshot of current metrics distributions like this:
Are my Lead Time distributions good for forecasting?
There are two types of distributions in terms of their fittnes for forecasting:
- Fat-tailed
- Thin-tailed
As the name implies, Fat-tailed distribution has a looong, ‘fat’ tail which results in bad process predictability and thus should be used for forecasting with caution.
On the other hand, Thin-tailed distribution, has a short tail and can be used to forecast future results.
How can we distinguish between them?
It’s easy - we must find how the 98th percentile relates to the Median (50th percentile).
If it is more than 5.6, then it is Fat-tailed distribution.
If it is less than 5.6, then it is Thin-tailed distribution.
What should we do with Fat-tailed distributions?
We need to find a way to trim this tail:
- You may have multimodal data in your Lead Time and you should try to extract it to separate datasets based on Class of Service, Type of Work, etc. which can result in several more thin-tailed distributions
- Do some analysis on tasks with longest Lead Times to determine what caused them to find a way to mitigate such issues in future
Sidenote: Do we need estimates?
It depends.
The purpose of estimation is to support decisions. If an estimate doesn’t help make a decision, then it doesn’t have any value. If an estimate does not lead to any decision or change in the system and knowledge of the estimate does not give you some value for prioritization (e.g. cost of delay) - it is a waste.
Conclusion
Consider gathering at least these metrics:
- Averages of
Lead Time,Cycle TimeandThroughputto discover their trends Lead Time,Cycle Timedistributions and their 80/90/95th percentiles to set SLEs and forecast
Using these metrics we can answer very important questions:
- When we must commit to particular work to deliver it on time? (
Lead Time) - How long does it take to deliver a work item? (
Lead Time) - How long do we actually deliver a work item? (
Cycle Time) - What amount of work we can deliver in a month? (
Throughput)
We can predict the future based on previous performance, but only with probabilities attached.
Also, keep in mind - these predictions work well for single pieces of work, but will not work as good for whole projects as they will accumulate uncertainty - there are other technics for this (mostly the Monte Carlo method) and we will look into it in another article - Project Forecasting.